
LEARNING.COMData Insights: Digital Literacy Assessments
Helping Students Thrive in a Digital World
My mission was to help school districts uncover exactly where their students stand with digital skills. With this knowledge, educators could create targeted lesson plans that truly address their students' needs rather than taking a one-size-fits-all approach.
My Role: Product Design, User Research, UX Architecture, Front-End Development | Tools: Adobe CC, Sketch, Angular, Bootstrap, SCSS, HTML
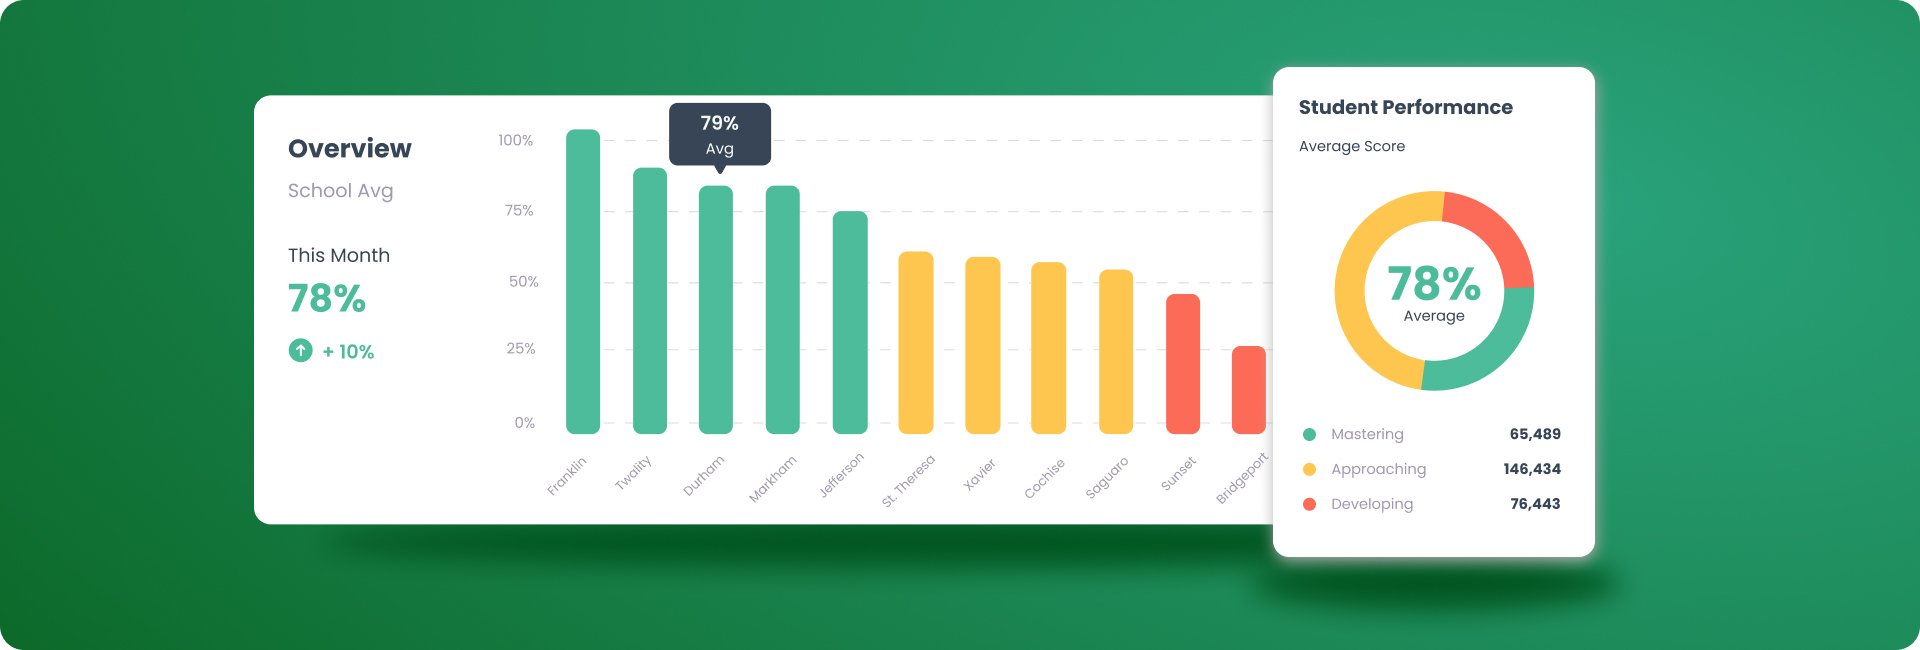
After students complete our assessment, Learning.com provides colorful, easy-to-understand dashboards for both administrators and teachers. These visualizations highlight strengths and areas for growth, giving educators clear direction on where to focus their teaching efforts.
The timing was perfect for an update! Our previous assessments were tied to outdated standards that didn't reflect today's technology landscape. With this project, we created fresh, relevant questions aligned with the latest ISTE 2016 concepts. As a bonus, we moved everything from Flash to HTML5, making the assessment more accessible and future-proof for schools everywhere.
Listening to What Customers Really Need
When talking with schools considering our content, accessibility kept coming up as a major concern. Schools also wanted better visibility into exactly where students were struggling so they could provide targeted support at every level - district, school, classroom, and individual student.
I grabbed coffee with folks from across our company - product managers, developers, customer support specialists, and our sales team - to really understand what customers needed from our Digital Literacy Assessment. One of my favorite parts of this project was partnering with Learnosity to integrate their assessment question templates through their API. This collaboration helped us make huge strides in accessibility compliance.

I would like to customize the lesson chrome to accommodate my needs.

I need to know how my schools, teachers and students are performing across my district.
Making learning equitable for everyone became my passion on this project. I reached out to the Oregon Commission for the Blind and invited a consultant to conduct a WCAG audit of our development process. These conversations transformed our team's understanding of accessibility - it wasn't just about checking boxes for compliance anymore, but about creating truly inclusive learning experiences. Together, we updated our design system with accessible code snippets and examples that the whole team could easily implement in future projects.
Making Assessments Fun and Insightful
Updating our technology was a big step forward! We moved to a modern Angular framework and integrated with Learnosity's powerful assessment tools. This tech refresh not only solved customer concerns but set us up for future success with better accessibility practices.
My creative process started with simple sketches and fun weekly "design swarms" where our product and development teams collaborated on new ideas. The energy in these sessions was contagious! I turned our concepts into interactive prototypes in InVision and got real user feedback through UserTesting.com to quickly validate what worked.
I found amazing inspiration in Intuit's beautiful design system and data visualizations. When redesigning our dashboards, I gathered a collection of UI inspiration examples and challenged our team to think outside the box with data presentation. These design sessions became something everyone looked forward to - they sparked creativity and pushed us beyond what we initially thought possible!


What We Learned
Students need accessibility settings that are crystal clear and easy to find
Simplifying language and reducing options in the assessment interface helps students focus on what matters
Teachers need organized, actionable data that clearly shows them what to teach next
Quick information on hover makes interpreting complex data sets much more intuitive


Real Results That Made a Difference
Our updated Digital Literacy Assessment was a win all around! We cut down production time significantly while achieving full WCAG compliance. Better yet, we reduced external costs while seeing a boost in both revenue and renewals - the perfect combination any project aims for!
As our own expert, who has spent over 25 years in education technology, wisely pointed out:
“With online assessments, it’s critical that students are equipped with technology skills – from simple navigation to typing to word processing... Assessments should be an indicator of students’ knowledge and proficiency, not how well they can type or use a computer.”
One of the most exciting outcomes was how the components and patterns we created for both the assessment content and analytics dashboards became building blocks for new projects. This "design once, use many times" approach has helped our team work more efficiently while maintaining consistency across products. What started as a single project improvement ended up elevating our entire product ecosystem!